Figure 5.

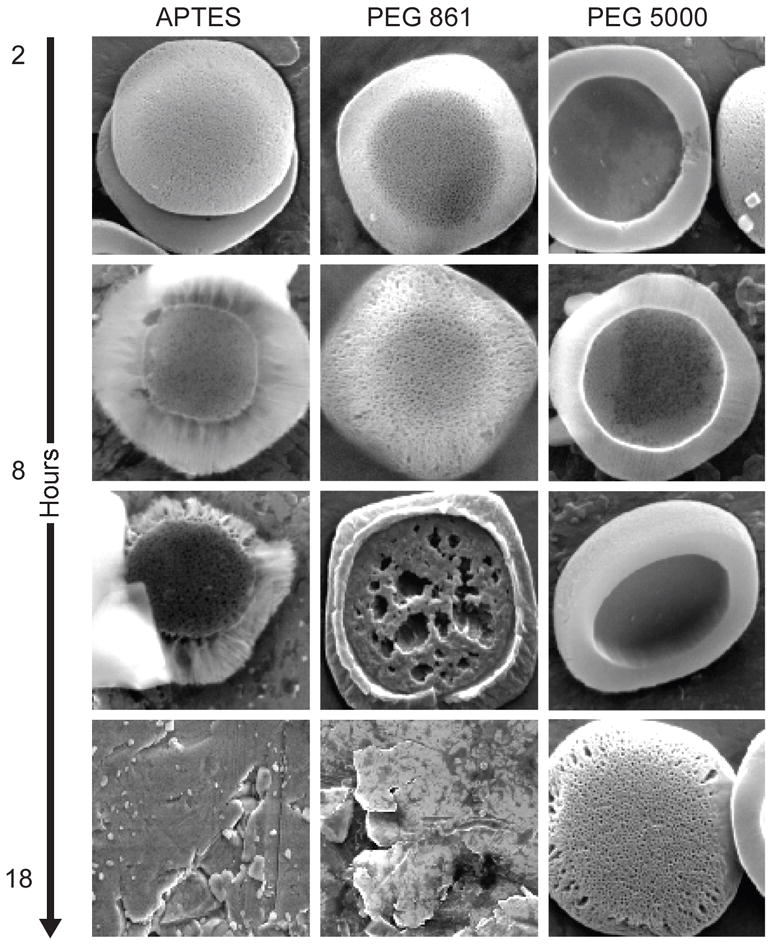
SEM images of the pSi particles during the degradation process in PBS pH 7.2. Systems shown: a) APTES particles; b) Particles modified with PEG 861; c) Particles modified with PEG 5000. Timepoints: 2, 8, 18 and 48 hours.

SEM images of the pSi particles during the degradation process in PBS pH 7.2. Systems shown: a) APTES particles; b) Particles modified with PEG 861; c) Particles modified with PEG 5000. Timepoints: 2, 8, 18 and 48 hours.