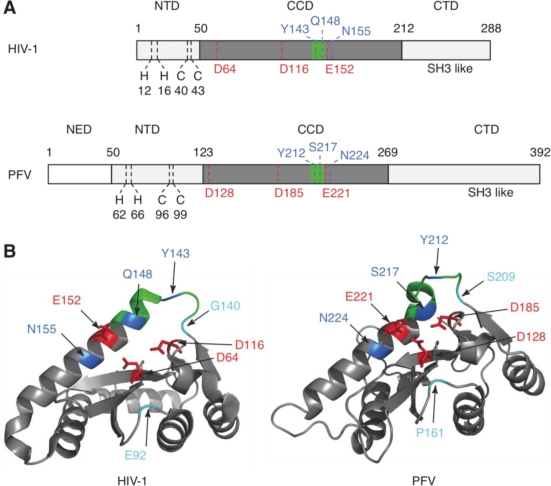
Figure 3.
HIV-1 and PFV IN structures. A. Comparison of the primary structures of HIV-1 and PFV IN. N-terminal (NTD) and C-terminal domains (CTD) are represented in light gray and catalytic core domains (CCD) in dark gray. The DDE motif is colored in red and mutations conferring resistance to RAL (positions 143, 148 and 155 for HIV-1; 212, 217 and 224 for PFV IN) are highlighted in blue. The flexible loop, comprising amino acids 140–149 for HIV-1 IN or 209–218 for PFV IN, is colored in green. B. Three-dimensional structure of HIV-1 and PFV IN core domains. Colors correspond to scheme A. In addition, amino acids 92 and 140 for HIV-1 IN and 161 and 209 for PFV IN are highlighted in light blue. Cartoon representations were obtained using MacPyMol version 0.99rc6 and the pdb file 2B4F (HIV-1 IN core domain, residue 57–207, with mutations F185K) and 3L2R (PFV IN complete structure with viral DNA and Mg/Zn cations, residue represented 123–269).

