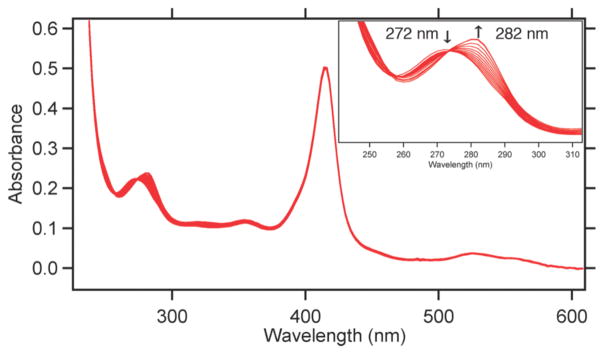
Figure 4.
Spectral changes that accompany Zn2+ binding to HPhen1 as monitored by UV-vis spectroscopy. Spectra show a typical ferric heme spectrum with a Soret band at 415 nm (ε = 0.148 μM−1 cm−1) along with a transition between metal-free (λmax= 272 nm) and metal-bound (λmax= 282 nm) Phen species. Inset: Close-up view of the UV region showing a clean isobestic point at 274 nm consistent with a 1:1 Zn2+:Phen binding model.

