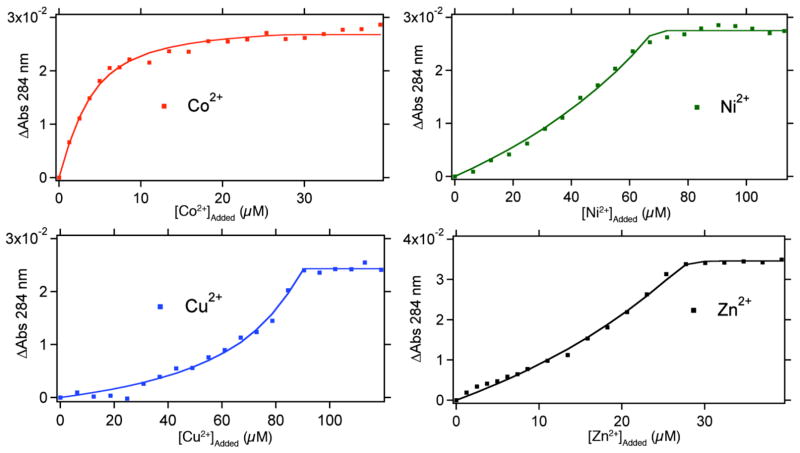
Figure 5.
Metal-binding titration data and fits for HPhen1 as monitored by UV-visible spectroscopy. A typical titration sample contained 2–5 μM of HPhen1, 50 mM MOPS buffer (pH 7) and 20–100 μM of the competing ligand EGTA. All data were described satisfactorily by a 1:1 binding model. Binding isotherms for HPhen2, HPhen3 are shown in Figure S1.2 and S1.3. Dissociation constants (Kd) determined are listed in Table 1 and S2.1.

