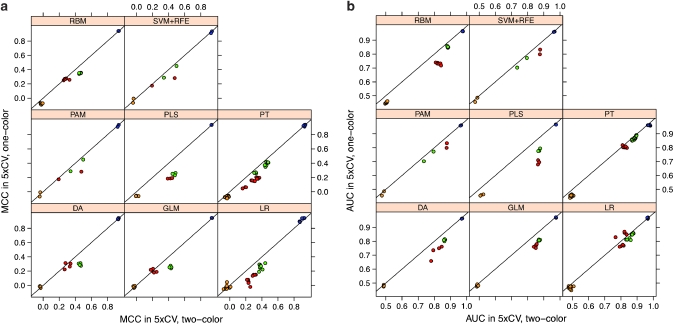
Figure 1.
Comparison of results classification from one-color vs two-color training data using 10 iterations of 5 × cross validation. The data shown are the mean results from 10 independent runs. A set of 9986 common probes and 244 samples was used to train the classifiers. For each endpoint, eight different classification methods were applied, namely discriminant analysis, general linear model selection, logistic regression, partial least square (PLS), partition tree, radial basis machine, prediction analysis of microarrays (PAM) and support vector machines plus recursive feature elimination (SVM+RFE) were selected for prediction. Values for MCC (a) and AUC (b) of the prediction results using one-color and two-color data are plotted against each other. Endpoints are coded by color: OS_MO (endpoint J), red; EFS_MO (endpoint K), green; patient's sex (endpoint L), blue; random classes (endpoint M), orange.

