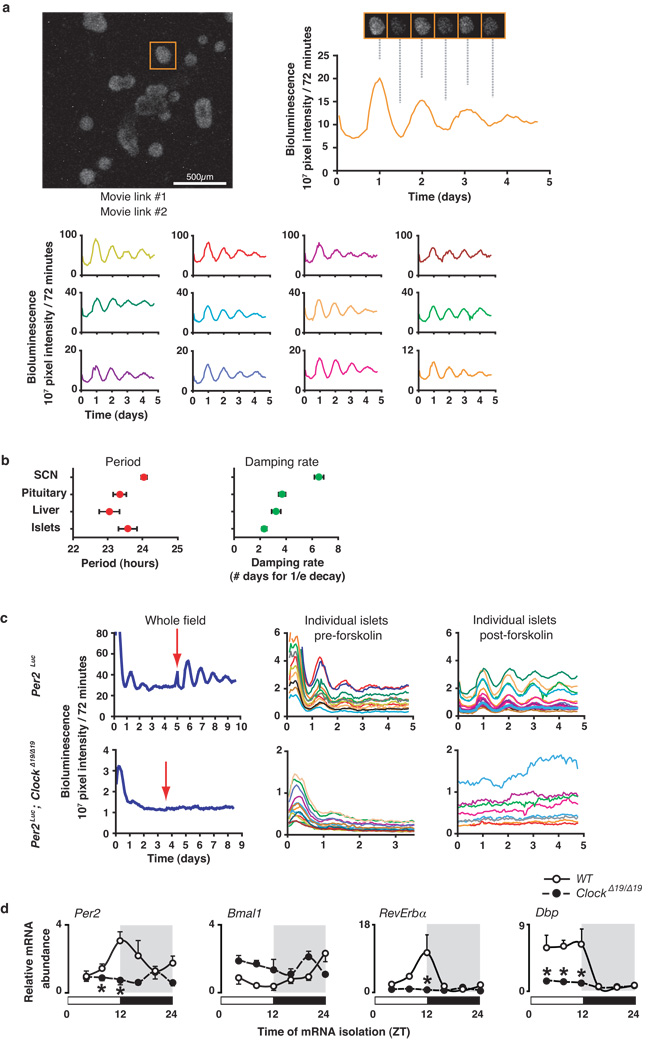
Figure 1. Cell autonomous oscillator in pancreas.
(a) Islets from Per2Luc mice were imaged, and orange trace at right represents bioluminescence rhythm collected from the islet in the orange square (left). Traces from other islets are shown below. See also Supplemental Movies 1–2. (b) Periods of luminescence and damping rate in multiple tissues (mean ± S.E.M., n=6 mice/genotype). (c) Whole field and individual traces from WT and ClockΔ19/Δ19 islets. Red arrow indicates exposure to 10 µM forskolin for 1 hour. (d) Oscillation of clock genes in WT and ClockΔ19/Δ19 mutant islets across 24 hrs (mean ± S.E.M., n=4 mice/genotype/time point, 2-way ANOVA, *p<0.05).

