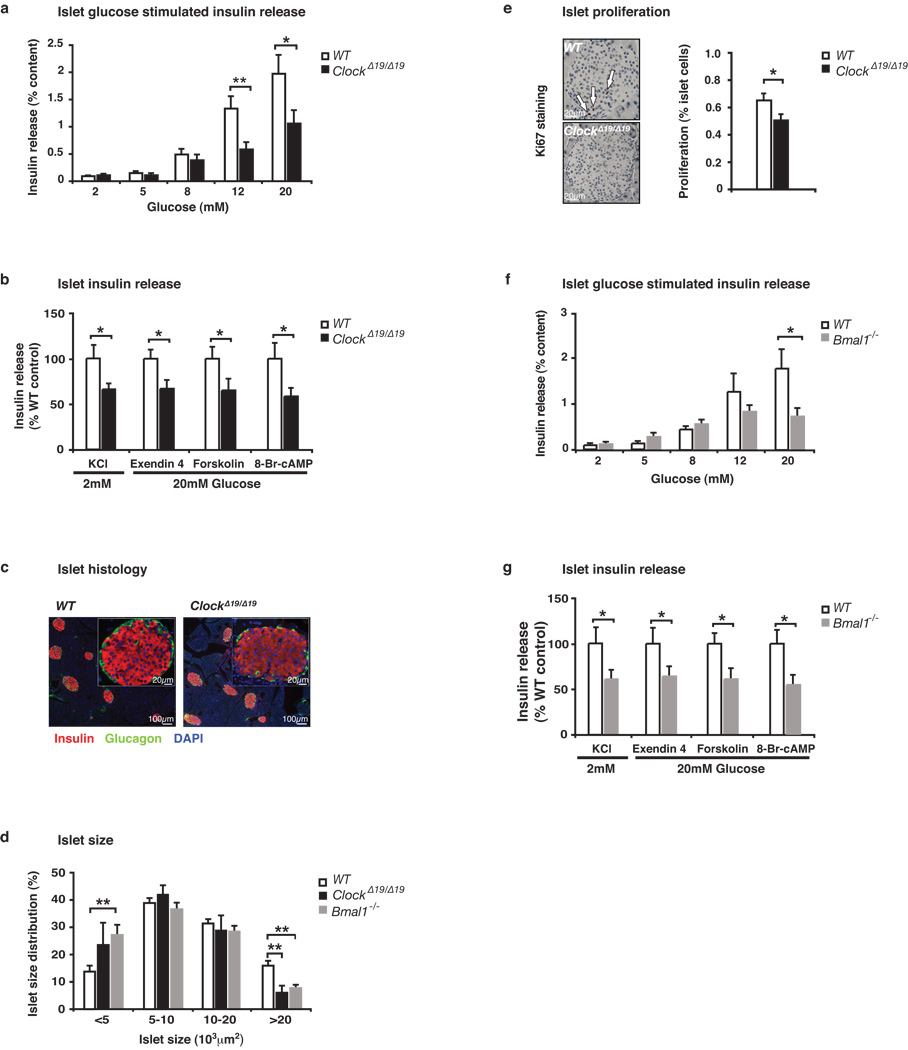
Figure 3. Reduced islet size, proliferation, and insulin release in 8–10 month old circadian mutant mice.
(a) Glucose-stimulated insulin release in isolated ClockΔ19/Δ19 islets compared to similar-sized WT islets (n=9–10 mice/genotype), normalized to % insulin content. (b) Insulin secretion from ClockΔ19/Δ19 islets in response to secretagogues (n=6–14). Insulin release was calculated as in (a), and ClockΔ19/Δ19 values are expressed as a percentage of WT. (c) Representative islet morphology in ClockΔ19/Δ19 and WT pancreata (body weight and pancreata weight were not different). (d) Size of islets isolated from ClockΔ19/Δ19 and Bmal1−/− mice compared to WT (n=6–9). (e) Ki67 staining of islet proliferation (ClockΔ19/Δ19 and WT, n=5–6). (f) Glucose-stimulated insulin secretion in Bmal1−/− islets compared to WT (n=5). (g) Insulin secretion from Bmal1−/− islets in response to secretagogues (n=6–10). Five islets per mouse were analyzed in triplicate for each test condition; data was analyzed by Student’s t-test. *p<0.05; **p<0.01, and values represent mean ± S.E.M.

