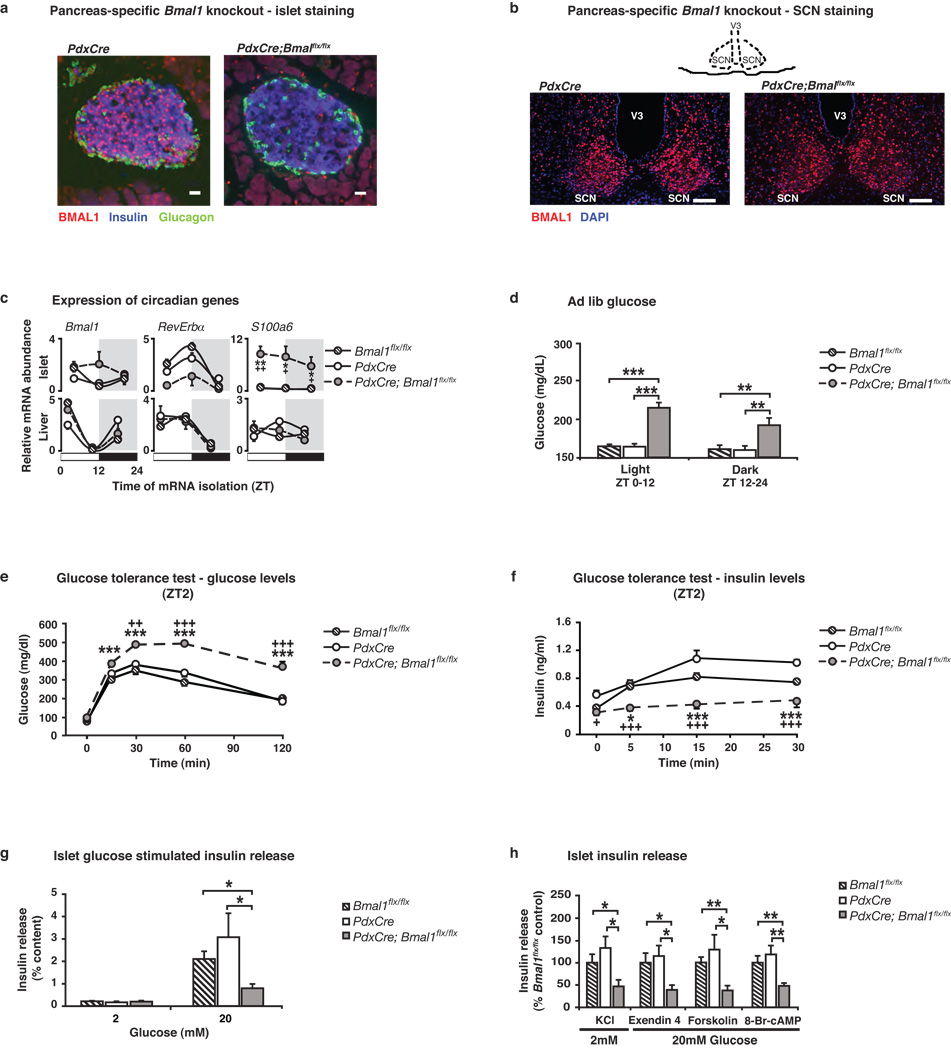
Figure 4. Impaired glucose tolerance and islet insulin secretion in 2–4 mo old pancreas-specific circadian mutant mice.
(a) Immunofluorescent staining of BMAL1 (red), insulin (blue), and glucagon (green) in PdxCre; Bmal1flx/flx and control islets (Scale bar, 25 m). (b) Immunofluorescent staining of BMAL1 (red) and DAPI (blue) in SCN of PdxCre; Bmal1flx/flx and control mice (Scale bar, 50 µm). (c) Oscillation of Bmal1, Rev-erbα, and s100a6 in islets and liver of PdxCre; Bmal1flx/flx mice at three sequential 8 hr time points (n=4 mice/genotype/time). (d) Blood glucose levels in ad lib fed PdxCre; Bmal1flx/flx mice, shown as the average for values in light and dark (n=9–10). (e) Glucose tolerance (n=6–8) and (f) insulin secretion (n=9–11) in PdxCre; Bmal1flx/flx mice at ZT2 following intraperitoneal glucose administration of 2 or 3g/kg body weight, respectively. (g) Insulin release in response to glucose in PdxCre; Bmal1flx/flx islets compared to size-matched control islets (n=5–7). (h) Insulin secretion from PdxCre; Bmal1flx/flx islets in response to secretagogues (n=5–7). For all studies, five islets per mouse were analyzed in triplicate for each concentration of glucose and secretagogue. Data was analyzed by 1-way (e,f) and 2-way (c) ANOVA, and Student’s t-test (d,g,h). *p<0.05; **p<0.01; ***p<0.001. For c,e,f, * denotes significance between Bmal1flx/flx and PdxCre;Bmal1flx/flx, and + denotes significance between PdxCre and PdxCre;Bmal1flx/flx. All values represent mean ± S.E.M.

