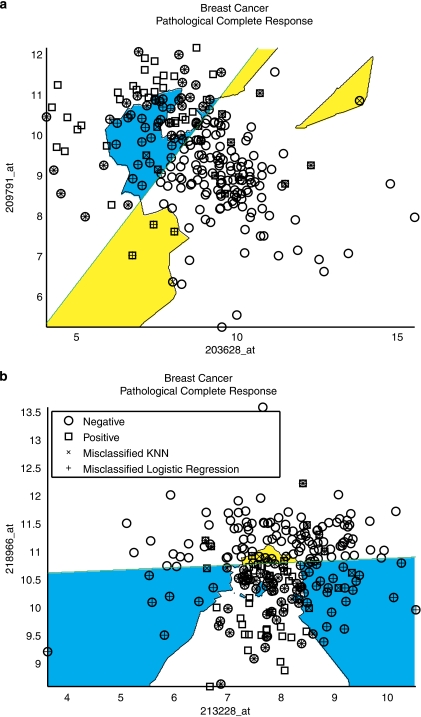
Figure 3.
Feature space comparison of a linear and nonlinear classifier on (a) genes that perform well individually and (b) genes that only perform well together. The straight line that separates the white+blue region from the white+yellow region represents the logistic regression decision boundary. KNN provides a curved decision boundary that disagrees with logistic regression in the blue and yellow regions.

