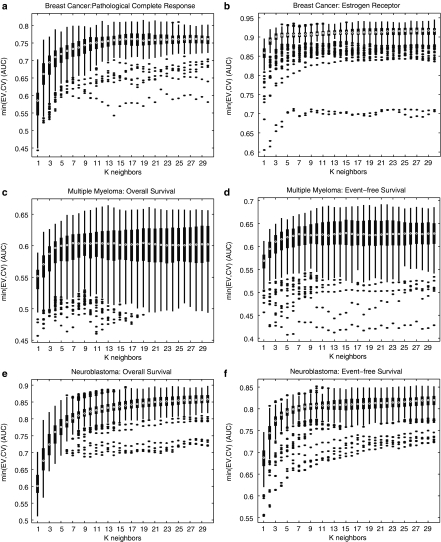
Figure 4.
Number of neighbors affects cross-validation performance for end points D, E, F, G, J, and K in subparts (a), (b), (c), (d), (e), and (f), respectively. Box plots represent the distribution of predictable performance (i.e., Min(CV,EV)) for the population of models with varying k using AUC. For each box plot, a white circle indicates the median; the black box joins the 25th and 75th percentiles and black dots indicate outliers. High medians with small range are desirable.

