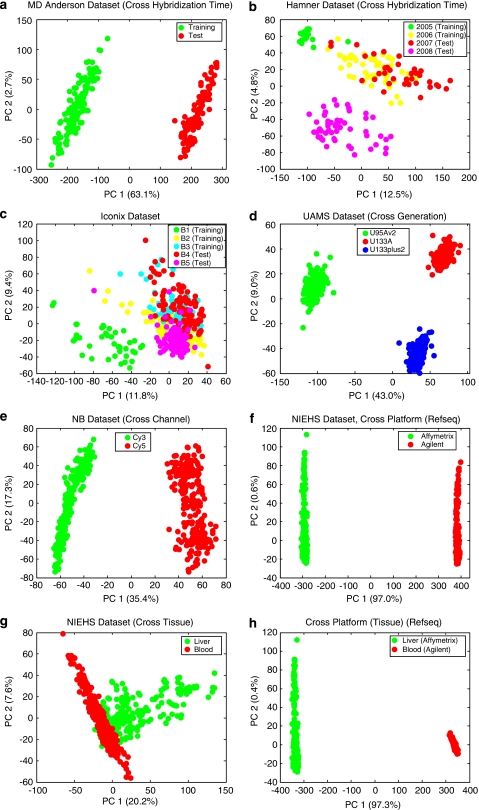
Figure 1.
Score plot of the first two principal components for the eight scenarios. Batches (groups) are indicated by colors. (a) MD Anderson breast cancer data set. (b) Hamner lung carcinogen data set (two batches in training set hybridized in 2005 and 2006, and two batches in test set hybridized in 2007 and 2008). (c) Iconix liver tumor data set (three batches in training set and two in test set). (d) UAMS multiple myeloma data set (the three batches represent three generations of Affymetrix chips on Homo Sapiens). (e) Cologne neuroblastoma data set (the two batches represent the two channels of Agilent arrays). (f) NIEHS data set (cross-platform: the two groups represent Affymetrix and Agilent microarray platforms. For brevity, PCA is performed for common genes with Refseq mapping only. The plots for common genes with Unigene and Sequence mappings are similar). (g) NIEHS data set (cross-tissue: the two groups represent liver and blood samples profiled on Agilent array). (h) NIEHS data set (cross-tissue-and-cross-platform: the two groups represent liver samples profiled on Affymetrix arrays and blood samples profiled on Agilent arrays).

