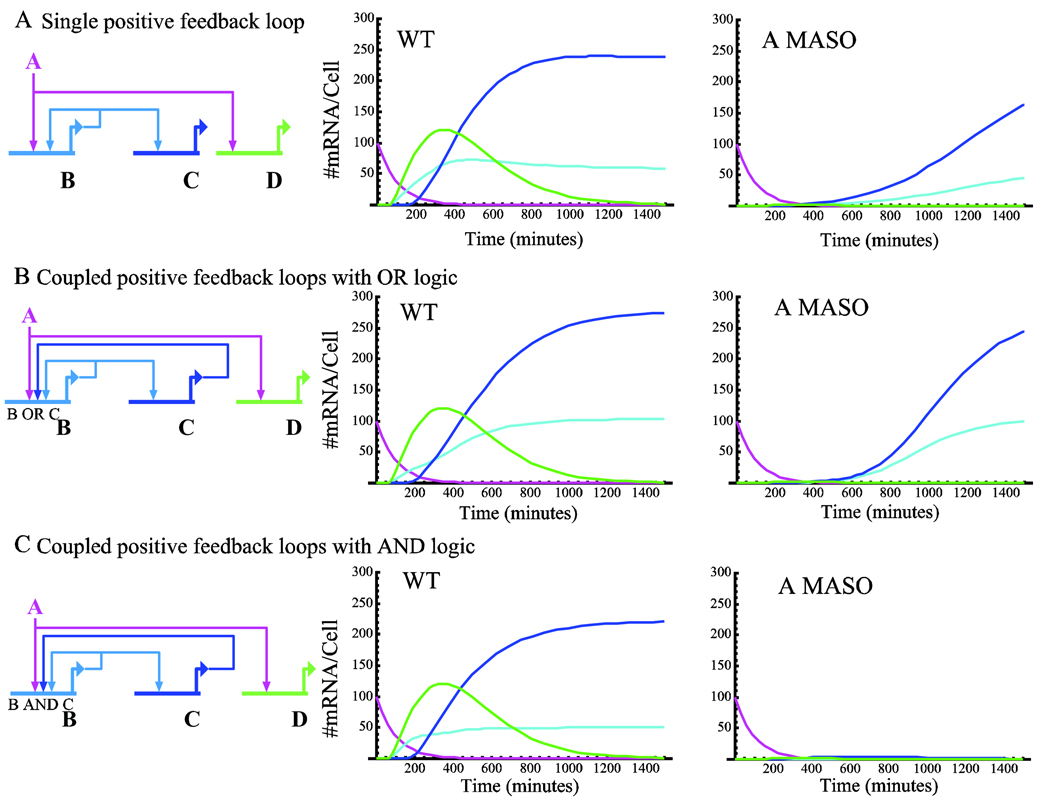
Figure 3.
Positive feedback circuitry. A. Single positive feedback loop circuit. Left: Schematic diagram of a single positive feedback circuit. The transient input A activates gene B, which encodes a transcription factor that feeds back into gene B and activates gene C. Middle and right: mRNA expression levels of single feedback circuit in the wild type condition (middle) and under A MASO treatment (right). Genes A and B mRNA and protein decay with Kdm=Kdp=0.01 min−1. Gene A is depicted in magenta, gene B in cyan, gene C is in depicted blue. For illustration of the maintenance function of the feedback circuitry we plot also the mRNA of gene D (green) that is downstream of A but does not execute positive feedback. B. Coupled positive feedback loops executing (A OR B OR C) logic. Left: Schematic diagram of the coupled circuit. It is similar to the circuit presented in A but gene C encodes a transcription factor that feeds back and activates gene B. middle and right: mRNA expression levels of coupled feedback circuit executing (A OR B OR C) logic, middle: wild type, right: A MASO. Same color scheme as in A. C. Coupled positive feedback loops executing [A OR (B AND C)] logic. Left: Schematic diagram of the coupled circuit. Middle and right: mRNA expression levels of coupled feedback circuit executing [A OR (B AND C)] logic, wild type: middle, A MASO: right. Same color scheme as in A. Kinetic parameters for all simulations are the same as in Fig. 1 (except from genes A and B as stated above.).

