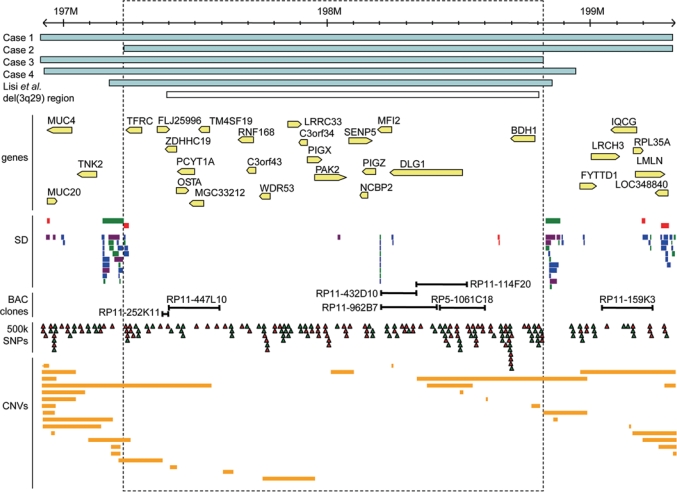
Fig. 4.
Microduplication region at 3q29. Scale at the top is in millions of base pairs (NCBI Build 35). The duplicated regions in four cases are shown (blue bars). The approximate location of the duplication described previously is shown (Lisi et al., 2008). The region of recurrent 3q29 microdeletion described in Willatt et al. (2005) is also indicated (white bar); this corresponds to the duplication reported in Ballif et al. (2008). Feature tracks from the Database of Genomic Variants are shown below: known genes (arrow indicating direction of transcription), segmental duplications (SD), SNPs on the Affymetrix 500K array set (red triangles: NspI array; green triangles: StyI array) and previously reported copy number variants (CNVs; orange bars). Locations of BAC clones used for FISH mapping (Case 1) or duplicated on BAC-CGH array (Cases 3, 4) are also indicated. Duplicated probe CTC-196F4 in Case 3 is located within BAC clone RP5-1061C18 (shown here; see also Willatt et al, 2005).

