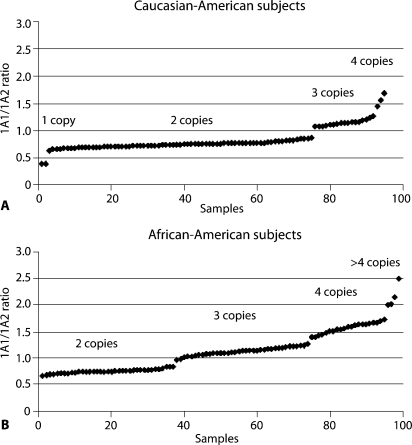
Fig. 2.
Peak height ratios of SULT1A1 to SULT1A2 for 100 DNA samples from both (A) Caucasian-American and (B) African-American subjects graphed to indicate SULT1A1 copy numbers (Hebbring et al., 2007, with the permission of Human Molecular Genetics).

