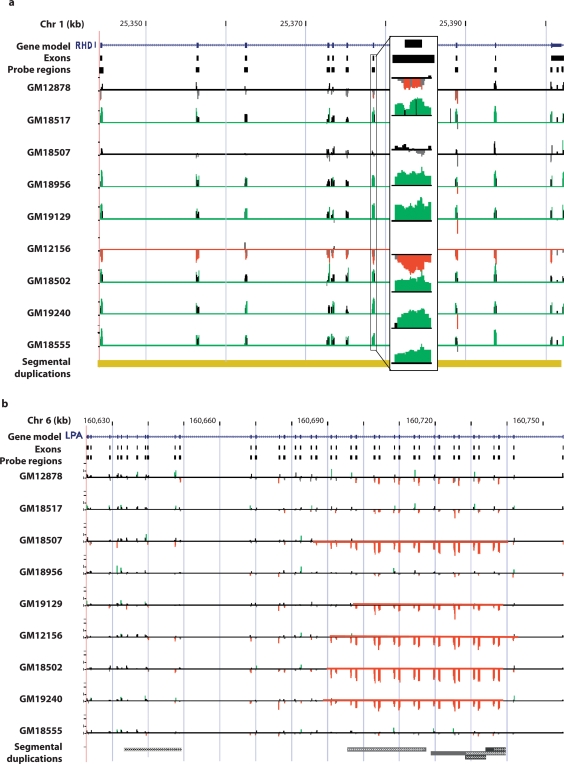
Fig. 2.
Examples of detected CNV transcripts. The observed relative signal intensities and results of the chaining algorithm are depicted for (a) the complete deletion of the RhD Blood group antigen gene (RHD) and (b) the partial-gene CNV of the lipoprotein Lp(a) precursor (LPA). Each gene is depicted (blue), the regions used for probe selection, and the relative signal intensities of the probes for each individual assayed. Individual probe signals with absolute relative deviations >1.0 SD are colored green for gain and red for loss. For RHD, an expanded area shows the probes for exon 6 in detail. The results of our detection algorithm are depicted by a red or green line indicating a region of loss or gain. In the case of RHD, these represent detection of gains and losses of the entire transcript. For LPA, the detected regions demonstrate partial transcript loss relative to the control. The region identified in LPA represents a series of variously-sized tandem deletions and duplications based on a 2-exon module containing Kringle domains. Vertical scales represent the natural log of the normalized relative hybridization intensities.

