
Fig. 6.
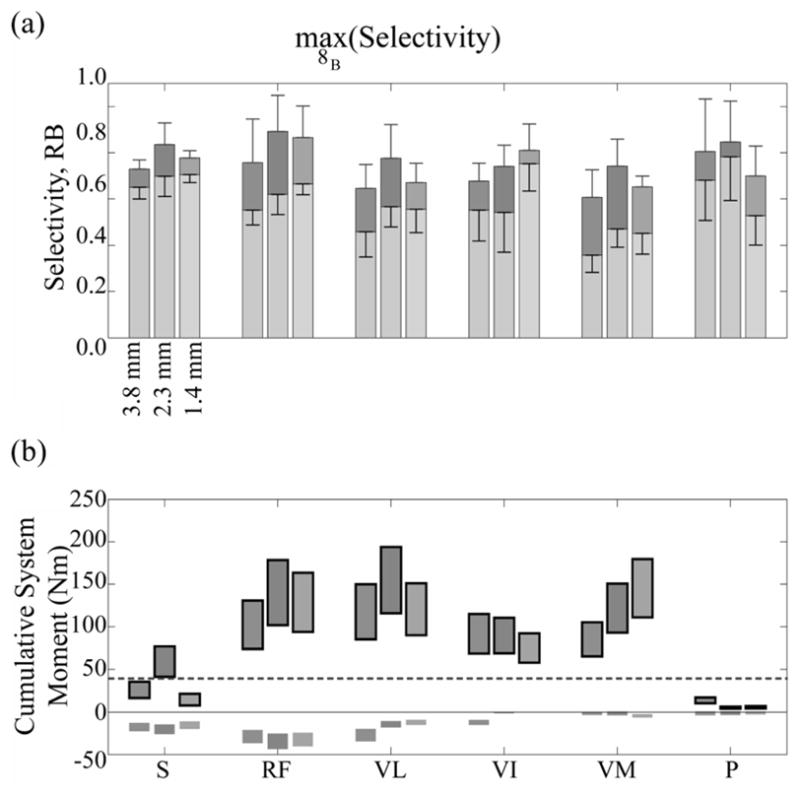
(a) Average selectivity obtained in all models for each fascicle group at given opening heights for fine 8b choose-1. Stacked upper bar is recruitment benefit (range: 0 to 1), lower bar is selectivity (range: −1 to 1). (b) Cumulative moment range arising from moment ranges produced by targeted activation of each muscle. Outlined moments were knee moments or were otherwise hip moments. Fascicular groups were defined in Fig. 4.