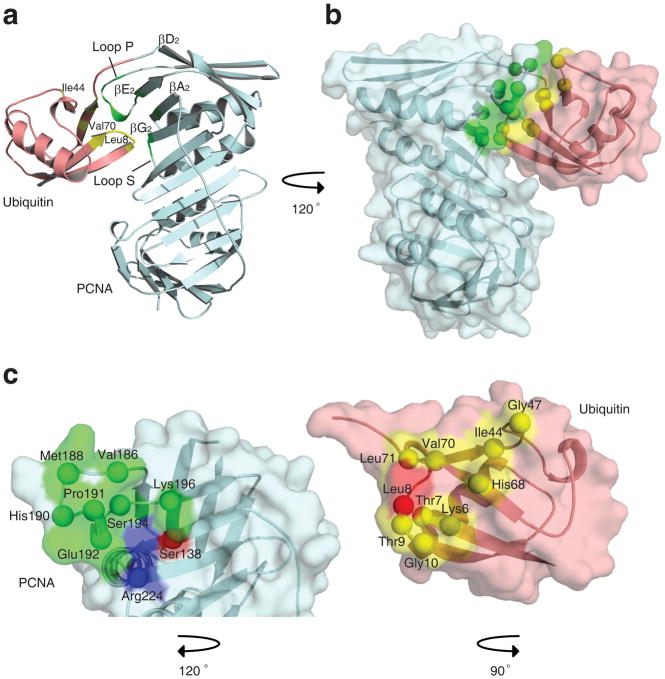
Figure 5.
Interactions between ubiquitin and PCNA within UbiPCNA. (a) Ribbon representation showing the ubiquitin-PCNA interface. The ubiquitin moiety is shown in red, and the PCNA is shown in blue. Regions of the ubiquitin moiety contacting the PCNA are shown in yellow, and regions of the PCNA contacting the ubiquitin moiety are shown in green. (b) Space filled representation of the ubiquitin-PCNA interface shown from a different angle. (c) Close up of the interfaces on the ubiquitin moiety and PCNA. The ubiquitin moiety and the PCNA have been separated and rotated relative to the orientation in panel B to show the binding surfaces on each. Residues forming hydrophobic contacts are shown in green and yellow for the PCNA and ubiquitin moiety, respectively. Residues forming electrostatic contacts are shown in blue and red.

