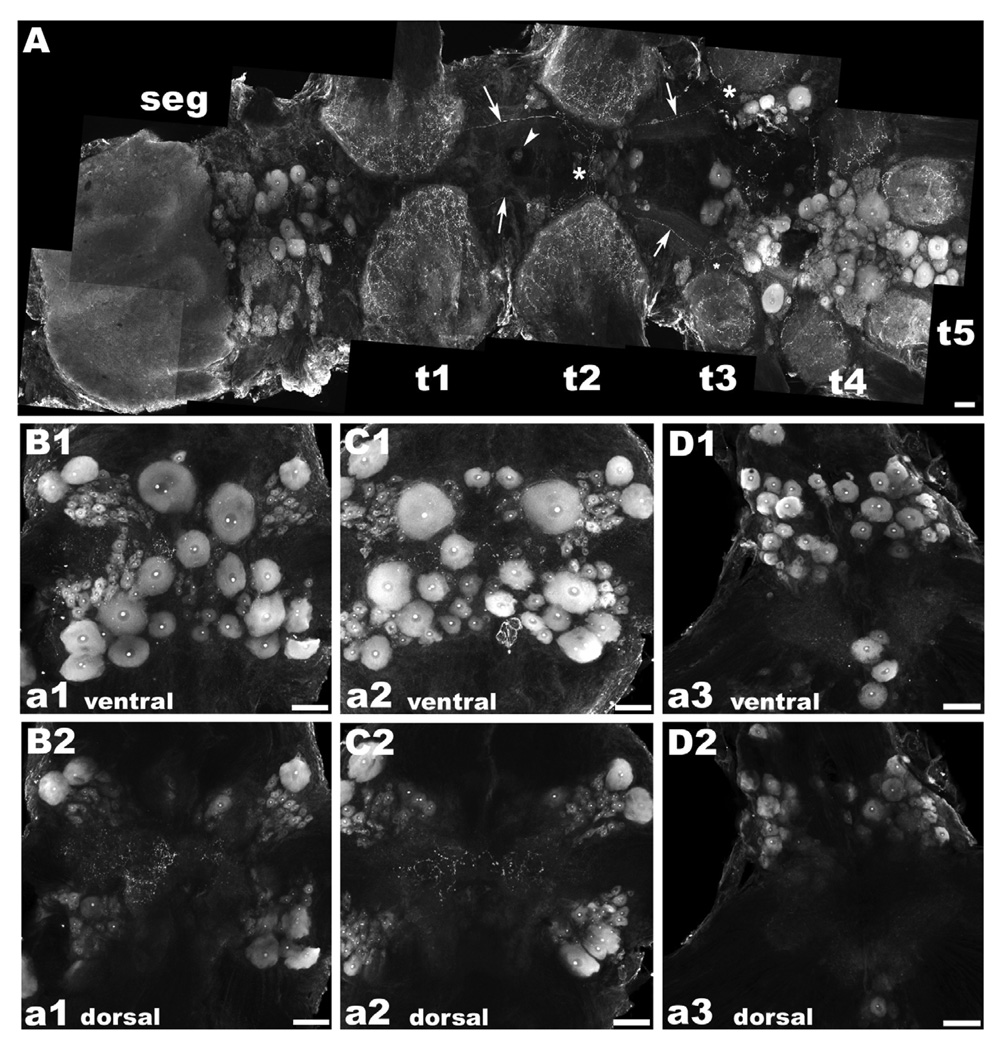
Figure 5. OA/TAMac immunoreactivity (ir) in the subesophageal (seg), thoracic (t), and abdominal (a) ganglia.
A: OA/TAMac-ir was found in a central cluster of large cells in the inferior portion of the seg, superior to t1. Punctate staining was also found in the neuropil of all five thoracic ganglia. Single OA/TAMac-ir large cells were found in the midline of the ventral nerve cord, at the t1 and t2 levels (white arrowhead). The t3–t5 ganglia showed the most prominent staining in large centrally located clusters of multiple-sized cells. A pair of bilateral axons extending from t1 to t3 was observed (white arrows), crossing the ventral midline towards the contralateral side at the t2 level, and other of their ramifications going towards the central, lateral, and inferior parts of the ganglia at the t3 level (white asterisks). B–D: In the abdominal ganglia, staining was observed in cells arranged in clusters, following a “butterfly wing” pattern in the first five ganglia (a1–a5), while a6 also had a pair of clusters of large OA/TAMac-ir cells and four additional cells oriented longitudinally, central and inferior of the neuropil area, extending towards the nerve roots. A representation of the ventral part of a1 (B1), a2 (C1), and a6 (D1) is shown. Punctate OA/TAMac staining was also observed in the neuropil area of all six ganglia. A representation of the dorsal part of a1 (B2), a2 (C2), and a6 (D2) showing the neuropil region is shown. Scale bar = µm.

