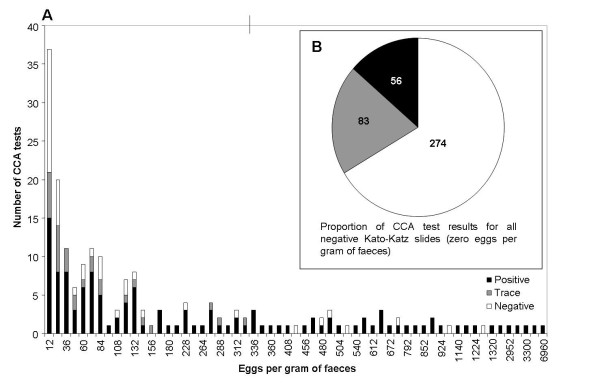
Figure 2.
Comparison of egg per gram (EPG) scores and corresponding CCA test result as 'positive', 'trace' or negative. (a) Number of CCA tests for a particular EPG score, and the breakdown of the tests into 'positive', 'trace' and 'negative' results. (b) Breakdown of CCA test results for schoolchildren who had zero S. mansoni eggs detected in their Kato-Katz thick smears.

