Figure 3.
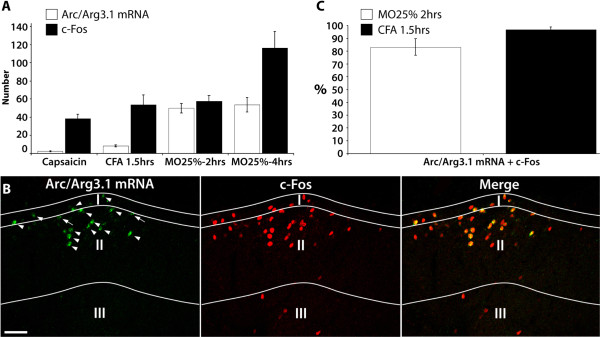
The number of neurons expressing c-Fos outnumber Arc/Arg3.1 mRNA labeled neurons. A, Histogram showing the number of neurons labeled for c-Fos or Arc/Arg3.1 mRNA following various nociceptive stimuli. capsaicin, n = 6; CFA1.5 hrs, n = 4; MO25%-2 hrs, n = 4; MO25%-4 hrs, n = 4. B, Fluorescent micrograph showing Arc/Arg3.1 mRNA and/or c-Fos protein labeled neurons in spinal dorsal horn after stimulation with 25% mustard oil for 2 hours. Arrows indicate Arc/Arg3.1 mRNA labeled neurons that were not in focus and therefore not included in the analysis. Arrow heads indicate Arc/Arg3.1 mRNA and c-Fos protein labeled neurons. C, Histogram showing the percentage of Arc/Arg3.1 mRNA labeled neurons that also express the neuronal activation marker c-Fos. Scale bar: 50 μm. Error bars represent ± SEM.

