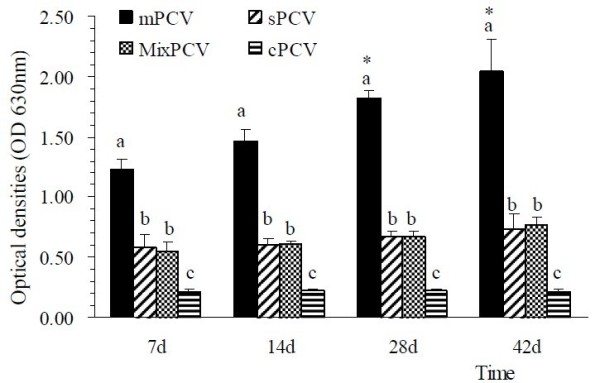
Figure 1.

Identification of special antibody of PCV2 for cPCV, sPCV, mPCV and MixPCV mice. X-axis represents the value at optical densities (OD630nm), Y-axis represents the days PI. Different letters "a", "b", and "c" represent significance. The level of significance was set at P < 0.05.
