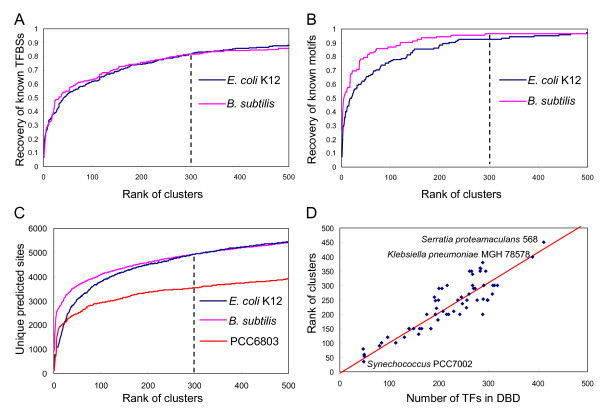
Figure 5.
Evaluation of the predictions in the groups of target genomes. (A). Cumulative recovery rate of known TFBSs in the input motifs by the top-ranked clusters. (B). Cumulative recovery rate of known motifs in the input motifs by the top-ranked clusters. (C) Cumulative number of unique predicted TFBSs in the top-ranked clusters. (D) The rank of the cluster at which the cumulative number of unique predicted TFBSs becomes saturated in a genome is highly correlated to the number of predicted TFs in the genome according to the DBD database.

