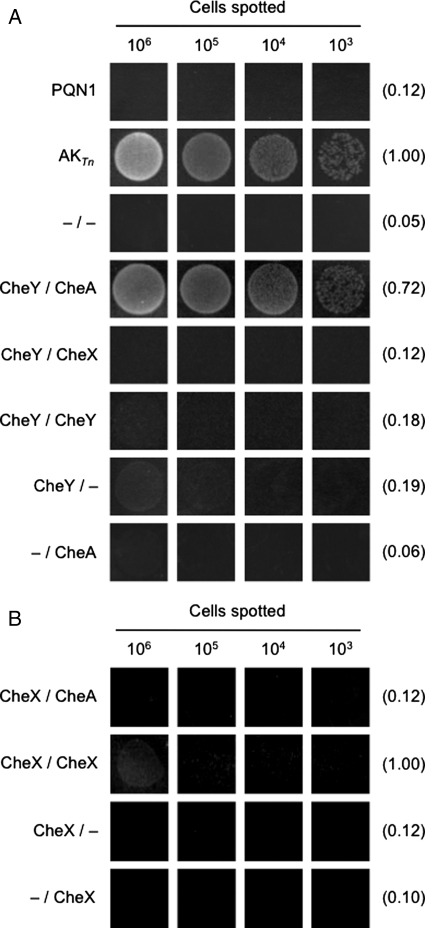
Fig. 4.
Detection of chemotaxis protein–protein interactions. (A) Analysis of CheAP1P2 and CheY binding using AKTn-fragment complementation. Relative growth after 24 h at 78°C of PQN1 alone (PQN1) and PQN1 transformed with vectors that coexpress TnN and TnCC156A (–/–), CheY-TnN and CheAP1P2-TnCC156A (CheY/CheA), CheY-TnN and CheX-TnCC156A (CheY/CheX), CheY-TnN and CheY-TnCC156A (CheY/CheY), CheY-TnN and TnCC156A (CheY/–), and TnN and CheAP1P2-TnCC156A (–/CheA). The relative integrated densities are reported in parenthesis relative to that of PQN1 cells expressing AKTn. (B) Analysis of CheX self-association using AKTn-fragment complementation. Relative growth after 24 h at 78°C of PQN1 cells transformed with plasmids that coexpress CheX-TnN and CheAP1P2-TnCC156A (CheX/CheA), CheX-TnN and CheX-TnCC156A (CheX/CheX), CheX-TnN and TnCC156A (CheX/–), and TnN and CheX-TnCC156A (–/CheX). The integrated densities are reported relative to that of PQN1 cells expressing CheX-TnN and CheX-TnCC156A. The spots in both panels represent different titers of cells aliquoted onto EvTM-Gelrite plates, which were obtained from liquid cultures incubated at 65°C in the presence of 5 µg/ml bleocin. ImageJ was used to quantify the density of cell growth relative to background levels for the spots corresponding to the highest titer. The number of cells spotted was calculated by assessing colony counts on EvTM plates incubated at 65°C for 48 h.

