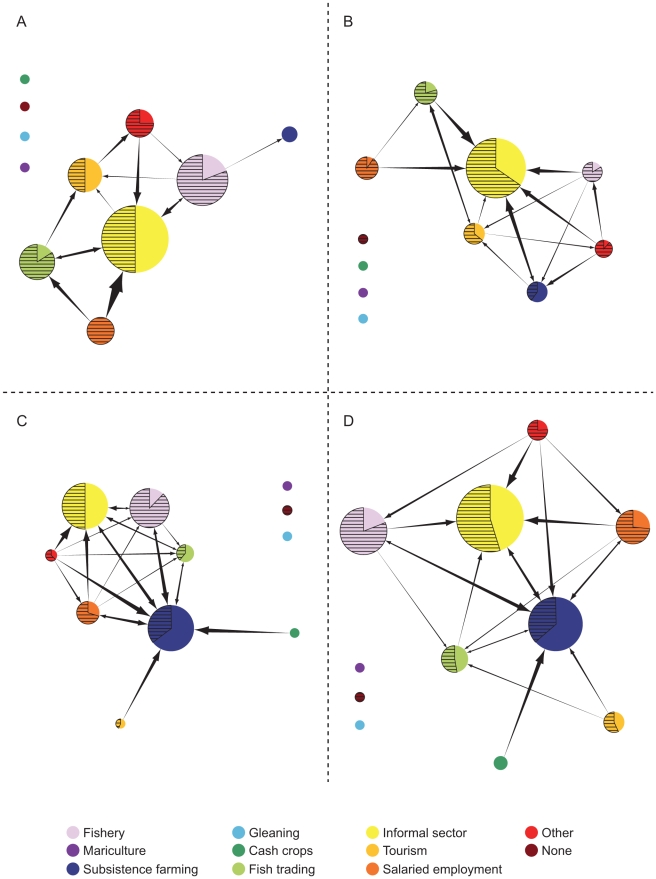
Figure 2. Kenyan livelihood landscape maps at various scales of social organization: a) Shela, Kenya; b) an aggregation of peri-urban sites in Kenya; c) an aggregation of rural sites in Kenya; d) all sites in Kenya.
Links between occupations are indicated by arrows The size of a node indicates the relative involvement in that occupational sector (larger node means more people are involved). The direction of the arrows indicates the priority of ranking. Thus an arrow into an occupation indicates that the occupation was ranked lower than the occupation the arrow came from. The thickness of the arrows corresponds to the proportion of households being engaged in the, by themselves, higher ranked occupation that are also engaged in the lower ranked occupation. The proportion of the node that is shaded represents the proportion of people that ranked that occupation as a primary occupation.

