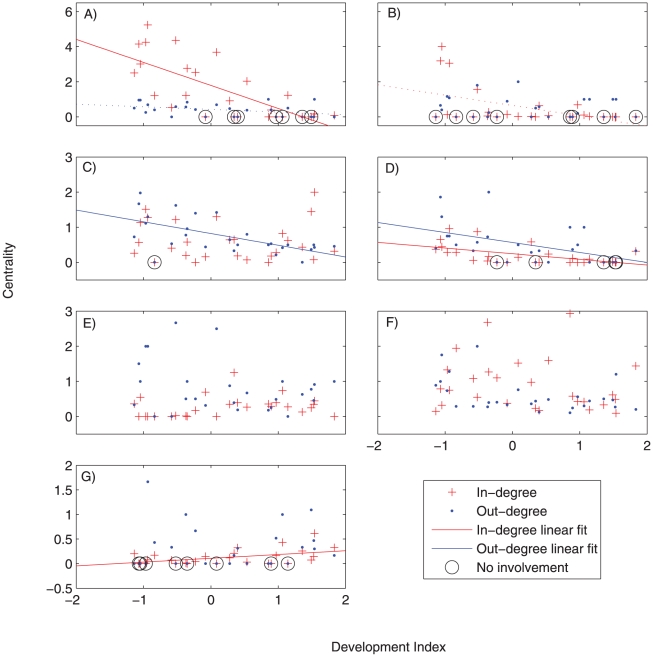
Figure 3. Relationships between a multi-variate index of socioeconomic development (x-axis) and centrality measures for key occupational sectors.
a) agriculture; b) cash crops; c) fish; d) fish trader/middle man, e salaried employment; f) informal economy, g) tourism. Significant relationships are indicated with trend lines (P<0.05, see Table 1). Dotted lines represent relationships where p<0.10. If the population density was a better predictor than socioeconomic development, or if the relationship is not significant, no trend lines are drawn. Note that 0 centrality due to no involvement in the occupation is distinguished from 0 centrality due to no incoming or outgoing links by a black circle surrounding the former; both were included in the regression analysis.

