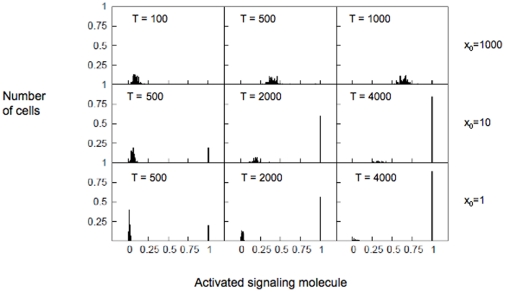
Figure 4. Probability distribution as a measure of cell-to-cell stochastic variability.
Probability distribution of activated  molecules under strong
  (top) , intermediate
  (middle), and weak
  (bottom) stimuli. Histograms were obtained using single cell
  activation data from a population of 100 cells. For the strong stimulus (top) probability distributions are shown for three time points T = 100, T = 500, and T = 1000. For the intermediate stimulus (middle), probability distributions are shown for three time points T = 500, T = 2000, and T = 4000. For the weak stimulus (bottom), probability distributions are shown for three time points T = 500, T = 2000, and T = 4000.

