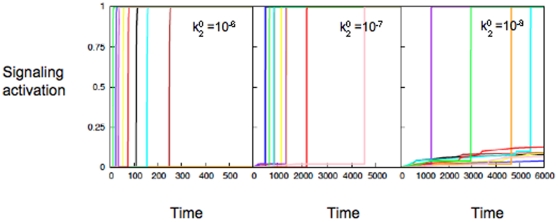
Figure 5. The slow step in the type B pathway modulates cell-to-cell stochastic variability.
Activation of  molecules at the single cell level for various values of the rate constant for the slow intermediate step (type B pathway):
  (left) ,
  (middle), and
  (right) stimuli. Different colors correspond to different individual cells.

