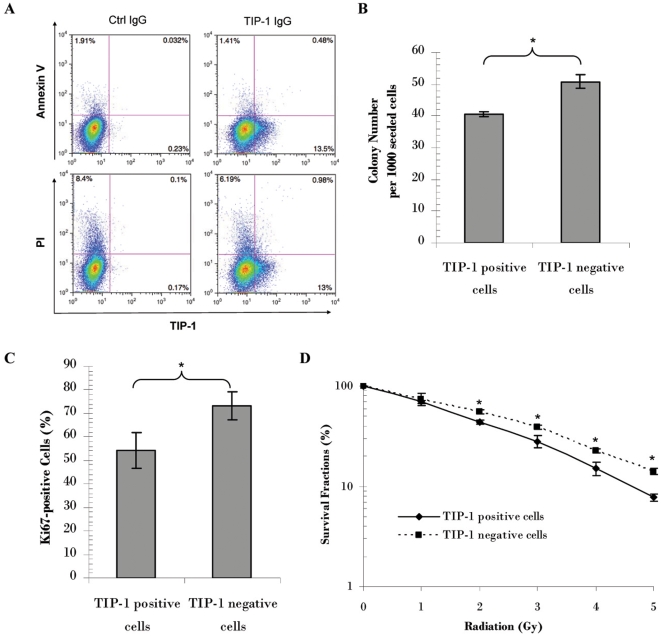
Figure 5. The TIP-1 translocation onto the cell surface is one biomarker other than those for the cell death and apoptosis.
A: Flow cytometric profile of TIP-1 expression on the cell surface, apoptosis (Annexin V) and cell death or membrane integrity (PI) at 24 hours after the radiation (5 Gy) treatment of the H460 cells. Percentage of the cells in each section was shown in the representative profile images from three independent experiments. B: Colony formation on petri dishes of the TIP-1 positive and negative cells sorted from the irradiated H460 cells. The H460 cells were irradiated at 5 Gy. The TIP-1 positive and negative cells were sorted 24 hours post the radiation treatment. Colony formation capability of the two subgroups of cells was shown as colony number per 1000 seeded cells. C: Proliferation capability of the sorted cells as determined with Ki-67 staining. Percentage of the proliferative cells among the counted cells was shown. D: Susceptibility of the sorted H460 cells to subsequent irradiation. Shown are data from clonogenic assays. Survival fractions were presented to show difference of the radiation susceptibility between the TIP-1 positive and negative cells. * P<0.05, n = 3, the Student's t-test.

