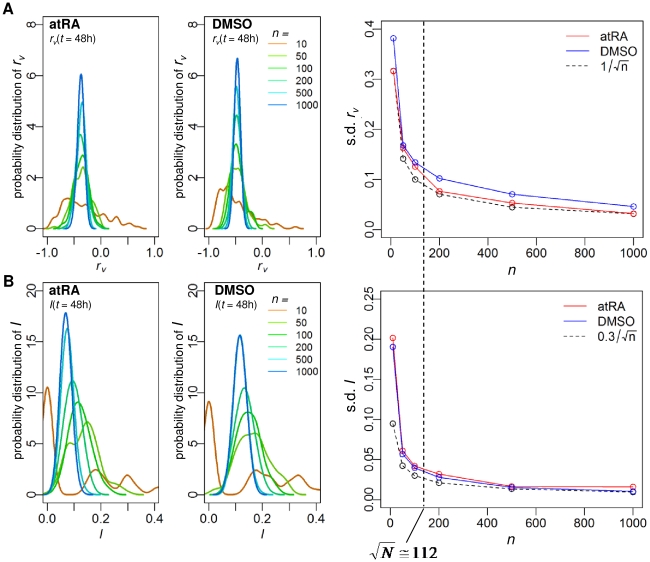
Figure 1. Transition from scattered to smooth bell shaped distributions of rv and I when grouping genes.
Distributions of (A) rv and (B) I for ensembles of n randomly chosen genes from whole genomes (n = 10, 50, 100, 200, 500, 1000), estimated by Gaussian kernel with 100 repeats at a representative t = 48h (similar profiles are obtained for all time points), left panels for atRA and middle panels for DMSO response. Standard deviation of rv and I distributions (right panels of (A) and (B)) at t = 48h decreases as n is increased, following a  law, α≅1 for rv and α≅0.3 for I. Note that this transition also occurred for all time points (data not shown).

