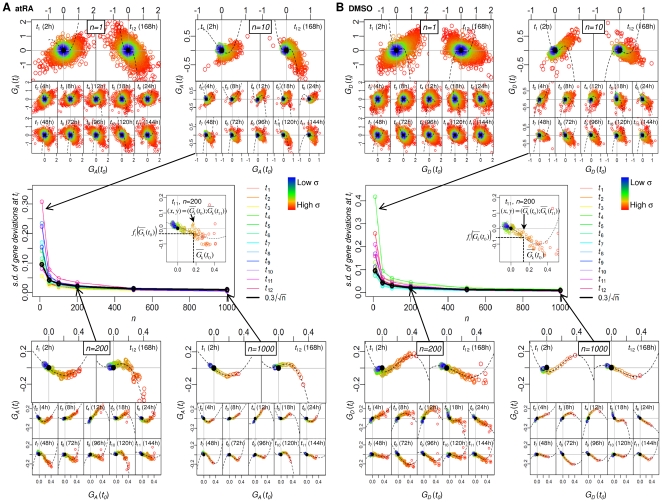
Figure 3. Transition from scatter to asymptotic emergent curves for the ranked groups.
Plot of set of mean values of gene deviations for p groups,  versus
  (i = 1,..,12) for atRA and DMSO responses (see maintext and Methods).
  and
and  represent mean values of gene deviations for atRA and DMSO respectively. As n is increased, the standard deviation of the ranked groups at ti,
  , decreases obeying the
  law (center panel, thick black line) where α≅0.3, for both atRA and DMSO, with a transition occurring around
  for (A) atRA and (B) DMSO. Each color represents each ti.

