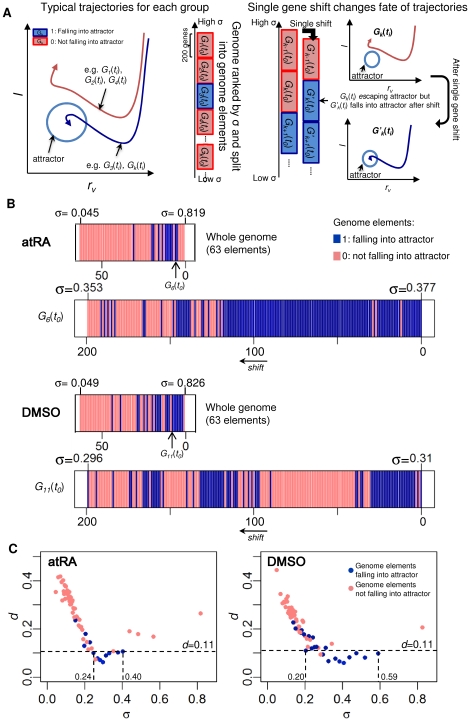
Figure 4. Specific genome elements guiding neutrophil cell fate in fractal manner.
(A) Sensitivity of genome elements falling to the attractor against standard deviation: left panel, schematic trajectories of genome elements,  (k = 1,…,63), into (blue) and not into attractor (red), sorted by standard deviation σ. Right panel, schematic of genome element with single-gene shift can change its fate to the attractor. Illustration shows the process of single-gene shift, i.e., removing the highest σ gene from an element
  not falling into attractor, and adding the highest σ gene of the next lower rank group
  , creates a new genome element,
  , that fall into the attractor. (B) Upper panels: the binary sequence of 63 genome elements atRA and DMSO responses represented by blue and light red, for 1 and 0 respectively. Lower panels, binary sequence of 199 additional genome elements were created using single-gene shift as in (A) for
  for atRA and
  for DMSO. (C) Euclidean distance d, between the whole genome's trajectory and each genome element's trajectory. More than 50% of genome elements that fell into the attractor are close to the minimum distance (d<0.11, indicated by a dotted line).

