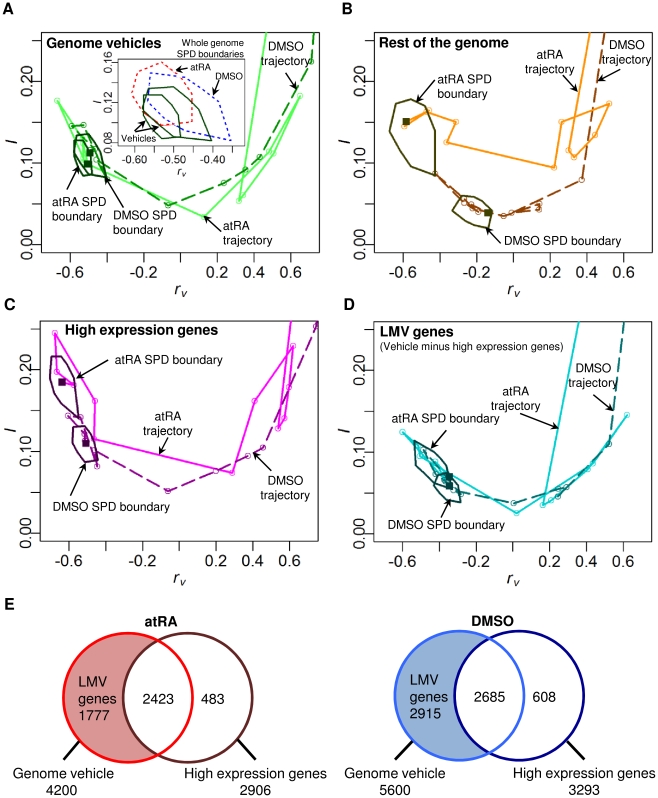
Figure 5. The loss of the attractor when genome vehicles are removed.
The SPD boundaries and trajectories for atRA (plain lines with lighter tone) and DMSO (dark dashed lines) responses of (A) genome elements falling into attractor (i.e., genome vehicles) overlap and converge, indicating the formation of neutrophil attractor. (Insert shows overlapping SPD boundaries of atRA and DMSO responses of the whole genomes, indicated by red and blue dotted polygons respectively), (B) rest of genome elements without genome vehicles do not overlap and converge, (C) high expression genes (2-fold change from t0 for at least one time point) of the genome vehicles do not overlap and converge, (D) lowly and moderately variable (LMV) genes of the genome vehicles still overlap and converge, retaining the neutrophil attractor. Data points are represented by circles and last time point by a square. (E) Venn diagrams showing the number of genes constituting the genome vehicles and high expression genes (atRA in red and DMSO in blue). Note that LMV genes constitute 42% and 52% of the genome vehicles for atRA and DMSO responses, respectively.

