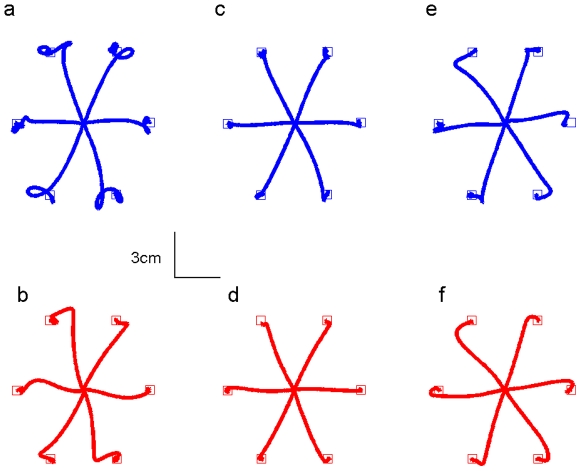
Figure 2. Single subject reaching trajectories.
Reaching of typical subjects from both Test group (top row) and Control group (bottom row). From left to right the pre-exposure, baseline and catch trials are shown. It is evident that the test group corrects later throughout the motion than the control group. Shown is the average of all movements on each block for the pre-exposure and catch trials and the average of the last 8 movements of the baseline.

