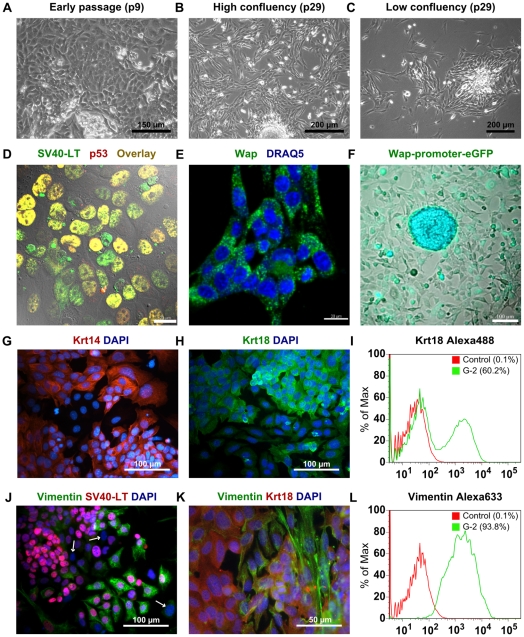
Figure 2. Characterization of G-2 cells in cell culture.
(A–C) Phase-contrast images of G-2 cells in an early (p9) and a later (p29) passage. (D) Confocal image of G-2 cells stained with anti-SV40-LT (green) and anti-p53 (red) antibodies. Images were merged with a differential interference contrast (DIC) micrograph. (E) Confocal image of G-2 cells stained with anti-Wap (green) antibody. Nuclei were visualized by DRAQ5 staining (blue). (F) Live-cell fluorescence image of G-2 cells after lentiviral transduction with an eGFP reporter construct under control of the Wap-promoter. FACS-enriched eGFP+-cells were kept in culture for 2 weeks. (G and H) Keratin 14 (red) and keratin 18 (green) immunostaining of cultured G-2 cells. Nuclei were visualized by DAPI staining (blue). (I) FACS-based quantitation of keratin 18 expression in G-2 cells at passage 20. (J and K) Vimentin (green) and SV40-LT (red)/keratin 18 (red) co-staining of cultured G-2 cells at passage 10. Arrows mark G-2 cells without detectable SV40-LT expression. Nuclei were visualized by DAPI staining (blue). (L) FACS-based quantitation of vimentin expression in G-2 cells at passage 20. Scale bars: A: 150 µm; B and C: 200µm; D and E: 20 µm; F, G, H and J: 100 µm; K: 50µm.

