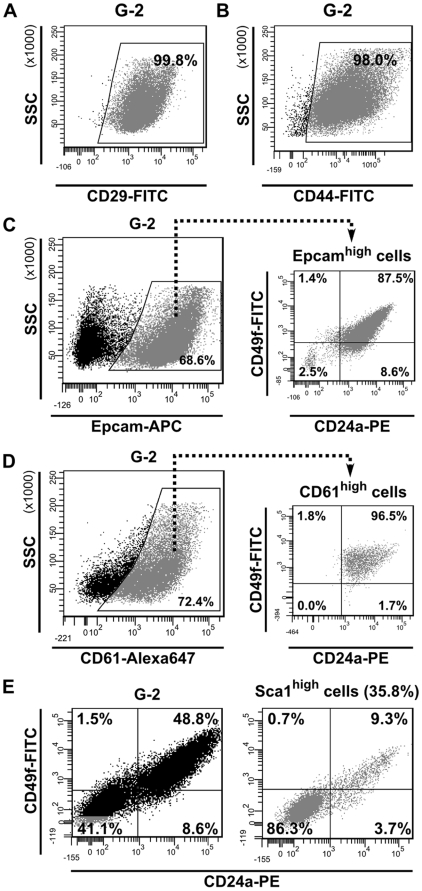
Figure 7. Expression of stemness-related cell surface markers in G-2 cells.
(A, B) Representative FACS dot plots showing the expression of CD29 (A) and CD44 (B) in G-2 cultured cells. (C) Representative FACS dot plots showing the expression of Epcam (C, left) in cultured G-2 cells and the distribution of CD24a and CD49f (C, right) within the Epcamhigh cell population. (D) Representative FACS dot plots showing the expression of CD61 (D, left) in cultured G-2 cells and the distribution of CD24a and CD49f (C, right) within the CD61high cell population. (E) Representative FACS dot plots showing the expression of CD24a and CD49f in cultured G-2 cells (E, left) and within the Sca1high (E, right) cell population.

