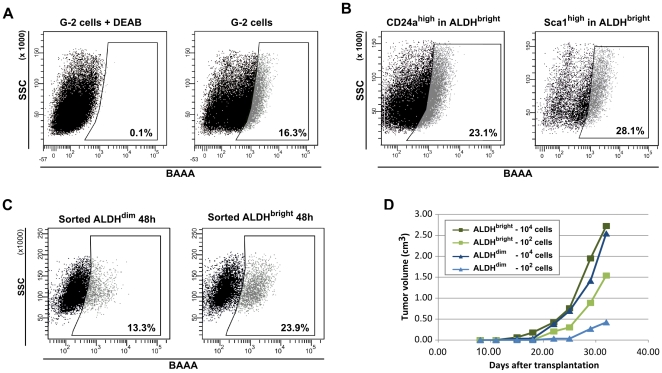
Figure 12. Properties of G-2 cell subsets differing in aldehyde dehydrogenase activity.
(A) Representative FACS dot plots showing ALDH activity of G-2 cells (A, right panel) measured with the Aldefluor reagent (BAAA). To define the ALDHbright gate, G-2 cells were stained with the Aldefluor reagent in presence of the ALDH inhibitor DEAB (A, left panel). (B) Representative FACS dot plots showing the expression of CD24a (B, left panel) and Sca1 (B, right panel) in the ALDHbright subsets. Fluorescence-values of the Aldefluor-channel (FITC) and the CD24a-channel (PE) were compensated before analysis of the CD24ahigh and Sca1high fluorescence. (C) Repopulation activity of the ALDHbright and ALDHdim subsets. 5×10⁵ FACS-sorted ALDHbright and ALDHdim cells were individually plated in 6-well plates. After 2 days in the culture, cells were analyzed for ALDH activity by Aldefluor staining and FACS. (D) The graph shows growth curves of tumors arising upon transplantation of ALDHbright and ALDHdim G-2 cells into the left abdominal mammary gland of virgin syngeneic mice (WAP-T-NP8). The dark and light curves, respectively, represent tumor growth kinetics of 104 and 102 transplanted cells in individual recipient mice.

