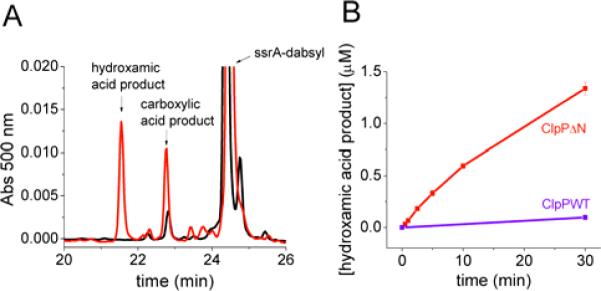
FIGURE 6. Degradation of ssrA-dabsyl with hydroxylamine produces the hydroxamic acid product.

A) ClpPΔN degradation of ssrA-dabsyl (0.125 μM ClpΔN14, 10 μM ssrA-dabsyl). Shown in black is the reverse-phase chromatogram of the reaction mixture after 30 min. in the absence of NH2OH. Shown in red is the chromatogram of the reaction mixture after 30 min. in the presence of 1.6 M NH2OH. B) Concentration of the hydroxamic acid product over time with 1.6 M NH2OH. (conditions: 0.125 μM ClpP tetradecamer, 10 μM ssrA-dabsyl). Error bars represent standard deviation of two trials.
