
Fig. 2.
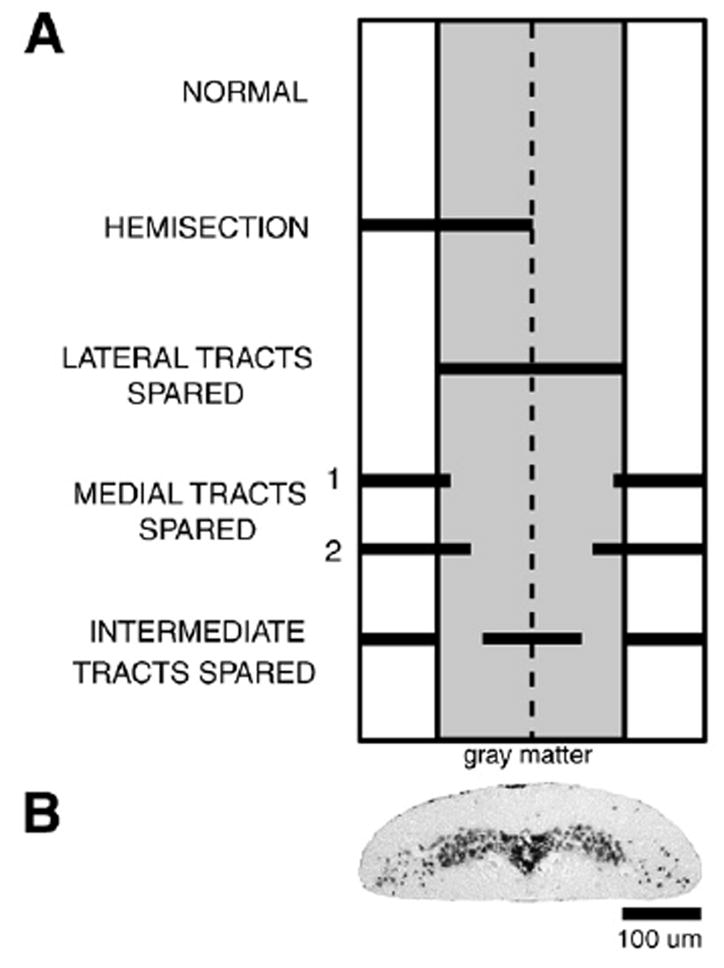
(A) Diagram of a dorsal view of the ribbon-like lamprey spinal cord (~100–150 μm thick×~1 mm wide) at 15% BL showing medial region that corresponds to the width of the “gray matter” (shaded area), “white matter” (lateral areas of cord), and midline (vertical dashed line). For comparison purposes, the different types of partial spinal cord lesions (solid horizontal bars; see Methods) are simultaneously displayed on the same diagram. (B) Photomicrograph of a cresyl violet-stained Paraffin transverse section of the spinal cord of a larval lamprey (80 mm) at ~15% BL (top is dorsal), showing central “gray matter” surrounded by “white matter”.