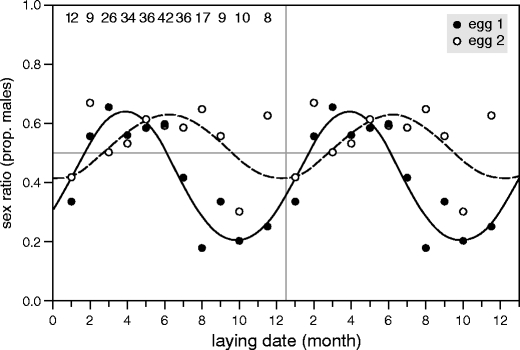
Fig. 2.

Double plot (right panel is a copy of the data presented in the left panel) of sex ratios (proportion males) in the course of the year in 239 Rock pigeon clutches of two eggs collected after 3 days of incubation (n = 478 embryos). Data are presented separately for first (solid lines, black dots) and second eggs (dashed lines, white dots) within the clutch. Symbols represent monthly averages. For the figure, the data of November and December were pooled due to small sample sizes. The lines represent, for eggs 1 and 2 separately, the fit of a model accounting for circannual variation in sex ratio (assuming a period of 12 months, see “Materials and methods”). The numbers refer to the sample size per month (number of clutches = number of first eggs = number of second eggs)
