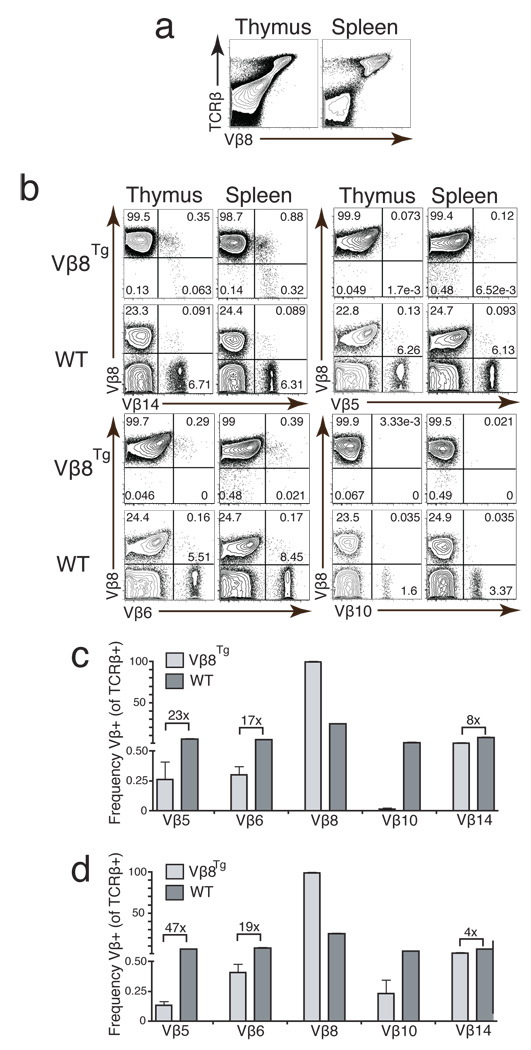
Figure 3. Vβ8Tg Mice Develop αβ T Cells Expressing a Limited Repertoire of Endogenous Vβ Segments.
(a) FACS analysis of Vβ8 expression in Vβ8Tg mice. Shown are representative plots of anti-Cβ and anti-Vβ8 stains conducted on thymocytes and splenocytes isolated from Vβ8Tg mice. Shown are representative plots of anti-Vβ8 and anti-Vβ14, anti-Vβ5, anti-Vβ6, or anti-Vβ10 stains conducted on thymocytes and splenocytes isolated from Vβ8Tg and WT mice. The percentages of cells within each quadrant are indicated. (c-d) Bar graphs depicting Vβ usage in (c) thymocytes or (d) splenocytes isolated from Vβ8Tg and WT mice. These analyses were conducted on mice of each genotype three independent times. The numbers above the bars represent fold differences in expression of the particular Vβ segment between the two genotypes. Error bars are SEM.

