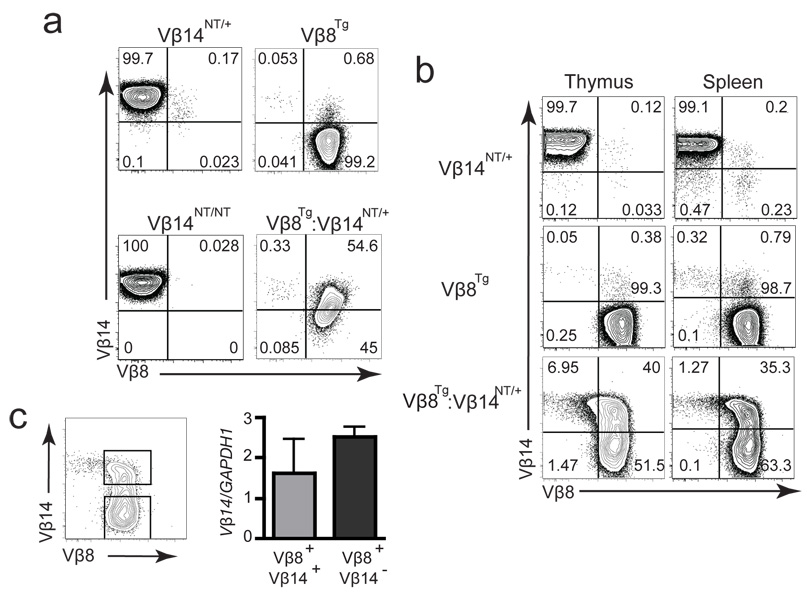
Figure 5. Silencing of Functional VβDJβCβ Genes in αβ T Lineage Cells.
(a) Intracellular FACS analysis of Vβ14 and Vβ8 expression. This analysis was conducted on mice of each genotype three independent times. Shown are representative plots of anti-Vβ14 and anti-Vβ8 intracellular stains conducted on thymocytes isolated from Vβ14NT/+, Vβ8Tg, Vβ14NT/NT, and Vβ8Tg:Vβ14NT/+ mice. The percentages of cells within each quadrant are indicated. (b) Extracellular FACS analysis of Vβ14 and Vβ8 expression. This analysis was conducted on mice of each genotype three independent times. Shown are representative plots of anti-Vβ14 and anti-Vβ8 stains conducted on thymocytes and splenocytes isolated from Vβ14NT/+, Vβ8Tg, and Vβ8Tg:Vβ14NT/+ mice. The percentages of cells within each quadrant are indicated. (c) qPCR analysis of Vβ14NT mRNA expression in Vβ8Tg:Vβ14NT/+ αβ T cells. The gating strategy for sorting of Vβ14+Vβ8+ and Vβ14+Vβ8− αβ T cells is shown on the left. A bar graph depicting the Vβ14NT mRNA levels relative to GAPDH mRNA levels in Vβ14+Vβ8+ and Vβ14+Vβ8− αβ T cells sort-purified from Vβ8Tg:Vβ14NT/+ mice is shown on the right. This experimental analysis was conducted three independent times. Error bars are SEM.

