Figure 2.

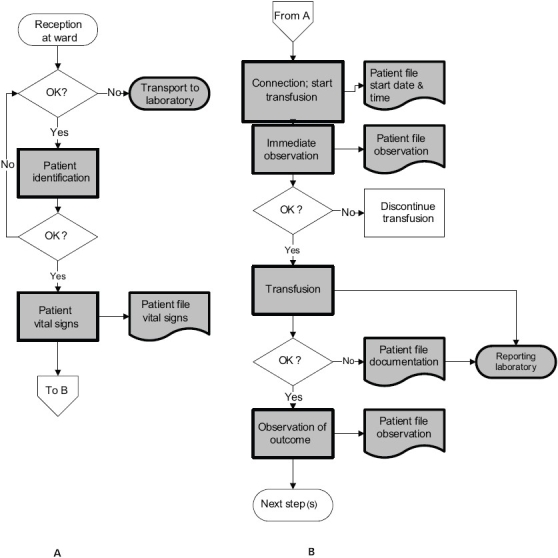
Flow chart for the reception of the blood unit on the ward (A) and the transfusion of the blood unit (B). The shaded symbols indicate the observed weaknesses in the bedside transfusion chain. (Smit Sibinga in: Popovsky 2007)[2]

Flow chart for the reception of the blood unit on the ward (A) and the transfusion of the blood unit (B). The shaded symbols indicate the observed weaknesses in the bedside transfusion chain. (Smit Sibinga in: Popovsky 2007)[2]