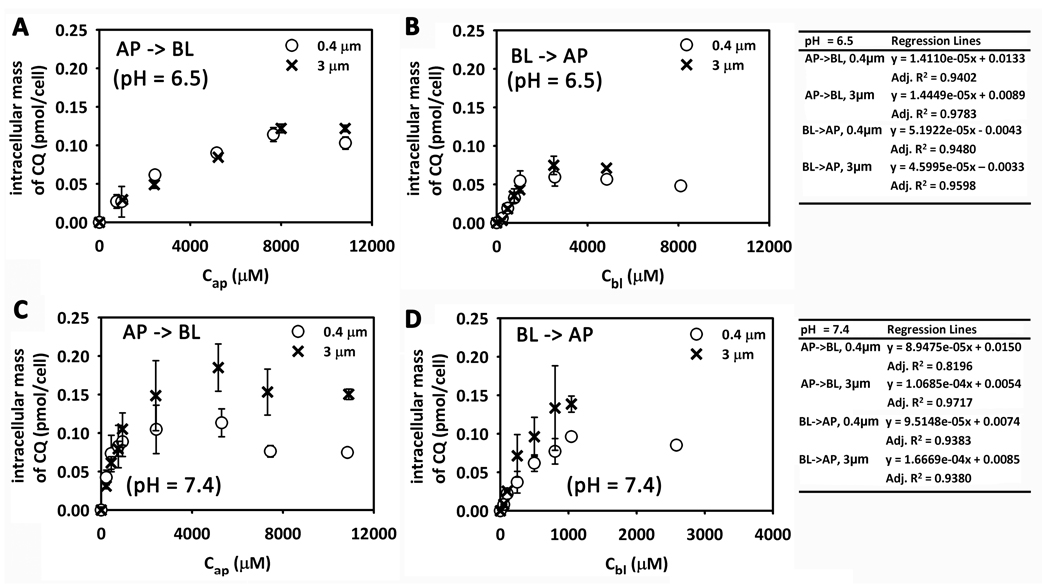
Figure 3.
The relationship between intracellular CQ mass and the initial concentration of CQ in the donor compartment. (A) AP → BL transport (pHa = 6.5). (B) BL → AP transport (pHb = 6.5). (C) AP → BL transport (pHa = 7.4).(D) BL → AP transport (pHb = 7.4). The linear regression equations shown in the table (right) were obtained from the four lowest concentrations tested.

