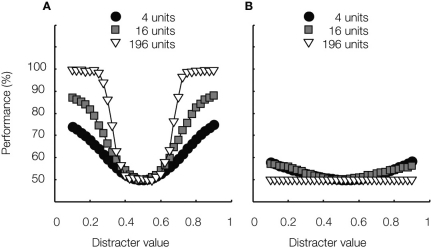
Figure 4.
The effect of pool size on classification performance. The average networks’ tuning function is shown in Figure 3C. Networks were further characterized by noisy neurons, inter-neuron variability in the 2-D tuning functions, and correlated noise. (A) Average classification performance is plotted as a function of distracter value for three different pool sizes, consisting of 4, 16 and 196 units, respectively. The test stimuli's location on the irrelevant dimension was identical to the training situation. Thus, these data express the selectivity of the considered networks. The smooth shape of the curves shows that the classifier can interpolate between stimuli encountered during training. (B) Same as (A) for the maximal test-training difference illustrated in Figure 3A; thus, these data express the tolerance of the considered networks. The large difference with the data shown in (A) shows that the classifier cannot extrapolate from stimuli encountered during training. Similar results were shown in Goris and Op de Beeck (2009).

