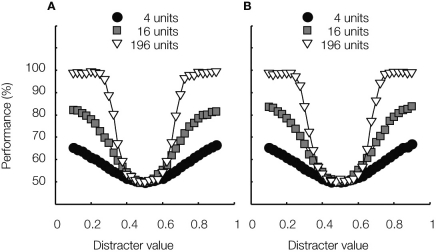
Figure 5.
Learned invariance. Average classification performance is plotted as a function of distracter value for three different network sizes, consisting of 4, 16 and 196 units, respectively. These networks were trained to perform identification at all five locations on the irrelevant dimension. (A) The test stimuli's location on the irrelevant dimension is indicated by the black arrow in Figure 3A. (B) The test stimuli's location on the irrelevant dimension is indicated by the lightest arrow in Figure 3A. These results were not part of the simulations in Goris and Op de Beeck (2009).

