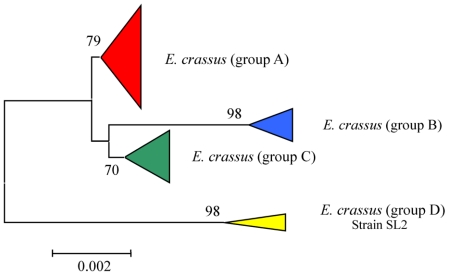
Figure 4.
Schematic representation of the phylogenetic tree, based on SSU-rRNA gene sequence comparisons, of different strains of Euplotes crassus. The numbers at the nodes are bootstrap percentages from 1000 replicates. The scale bars correspond to a distance of 2 substitutions per 1000 nucleotide positions.

