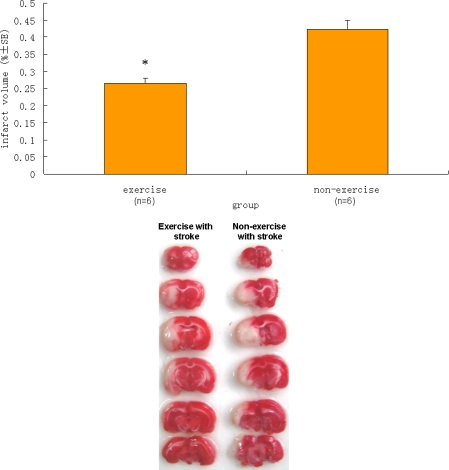
Figure 4.
Difference in infarct volume between the exercise group and the non-exercise group. Top panel: Data are mean ± S.E. (n = 6). The infarct volume of the sham group of six rats was zero (not shown). * denotes a statistically significant difference in the mean infarct volumes of the exercise group and the non-exercise group (P < 0.05). Bottom panel: 2 mm coronal sections show ischemia (pale regions) and healthy tissue (red).

