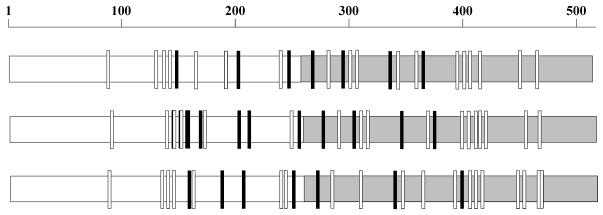
Figure 1.
N-glycosylation sequons in gp120. The N-glycosylation sequons vary in number and distribution in gp120 as exemplified here by three sequences AY247224 from 1981 (top), EU289201 from 1995 (middle) and GU080199 from 2009 (bottom). The NXS sequons are represented as small black rectangles and NXT as white rectangles. The C terminal regions of the sequences are gray shaded.

