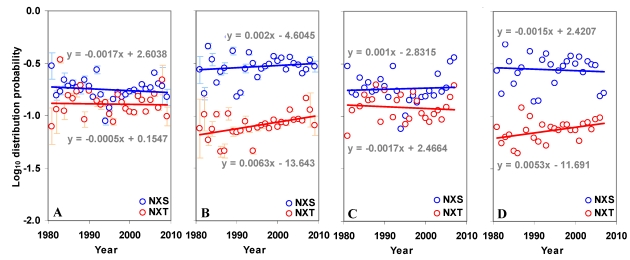
Figure 6.
Distribution of sequons in gp120. (A) The log10 distribution probabilities of NXS and NXT have remained same over time in the N terminal region. (B) The log10 distribution probability of NXT is increasing (t = 2.70) over time in the C terminal region. Comparable patterns are observed (C and D) when gp120 of HIV-1 subtype B is considered alone.

