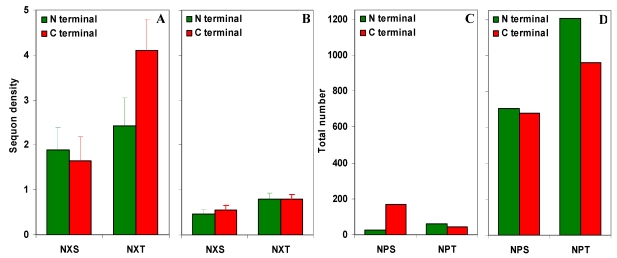
Figure S1.
NXS/T sequons in gp120. (A) The observed density of NXS/T (where X is not proline) sequons in gp120. (B) The predicted density of NXS/T sequons is about four times lower compared to the observed density. (C) The observed number of NPS/T sequences in gp120. (D) The predicted number of NPS/T sequences is about 12 times higher compared to the observed number.

